Note
Click here to download the full example code
Plotting lines
Plotting lines is handled by pygmt.Figure.plot.
import pygmt
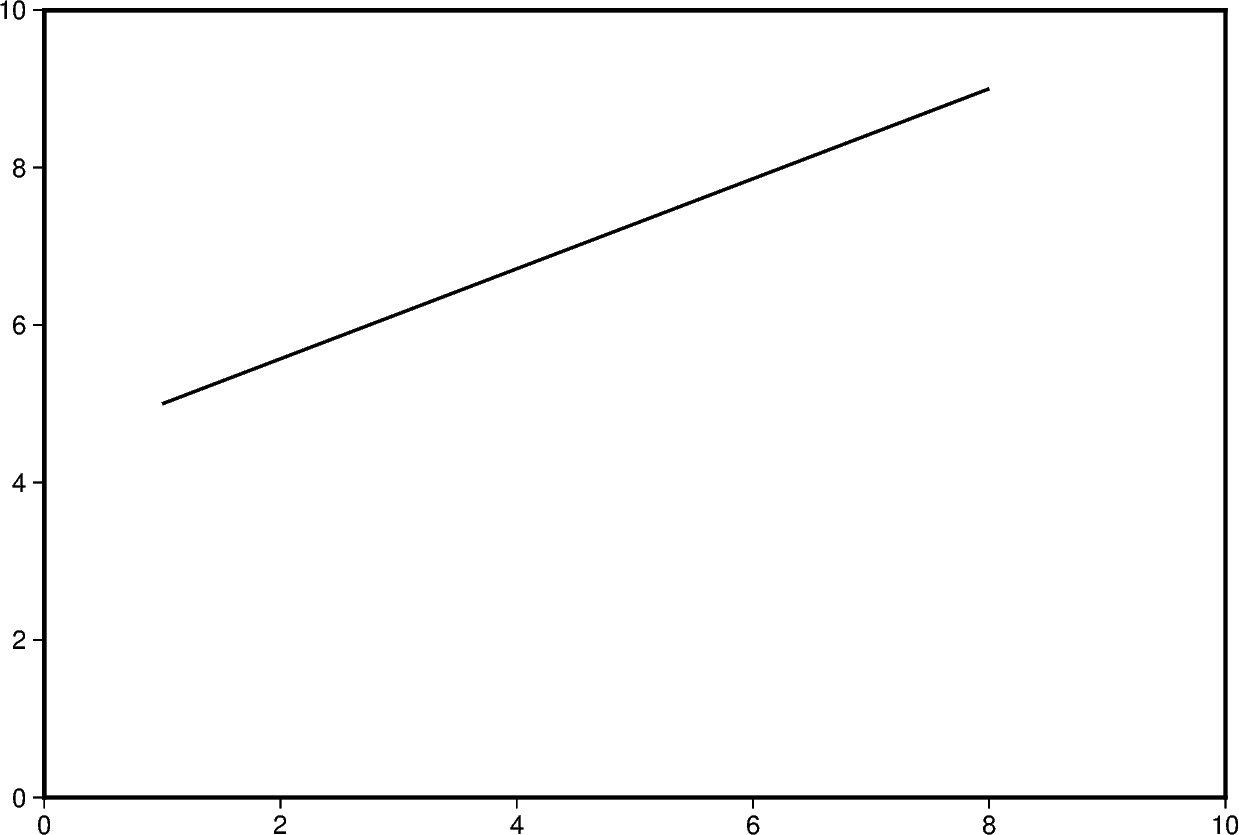
Plot lines
Create a Cartesian figure using projection parameter and set the axis
scales using region (in this case, each axis is 0-10). Pass a list of
x and y values to be plotted as a line.
fig = pygmt.Figure()
fig.plot(
    region=[0, 10, 0, 10],
    projection="X15c/10c",
    frame="a",
    x=[1, 8],
    y=[5, 9],
    pen="1p,black",
)
fig.show()
Out:
<IPython.core.display.Image object>
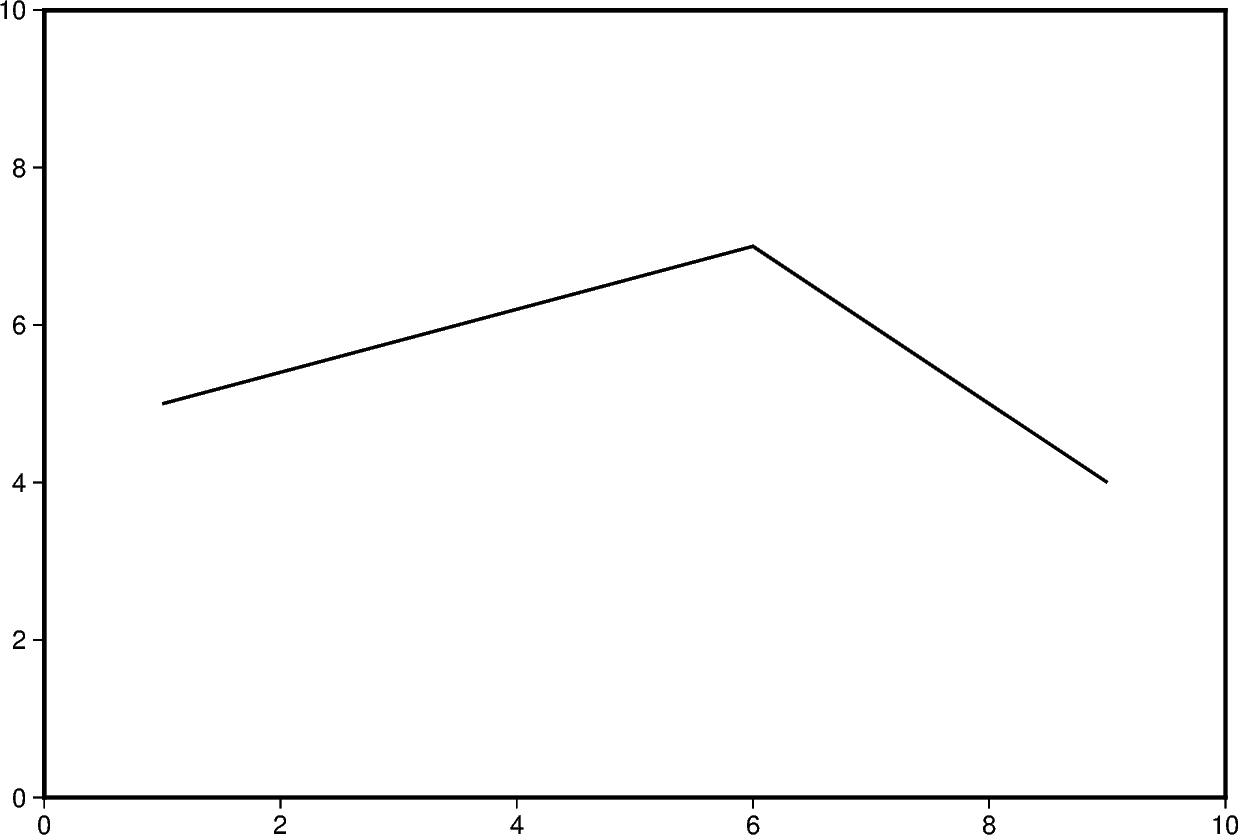
Additional line segments can be added by including additional values for
x and y.
fig = pygmt.Figure()
fig.plot(
    region=[0, 10, 0, 10],
    projection="X15c/10c",
    frame="a",
    x=[1, 6, 9],
    y=[5, 7, 4],
    pen="1p,black",
)
fig.show()
Out:
<IPython.core.display.Image object>
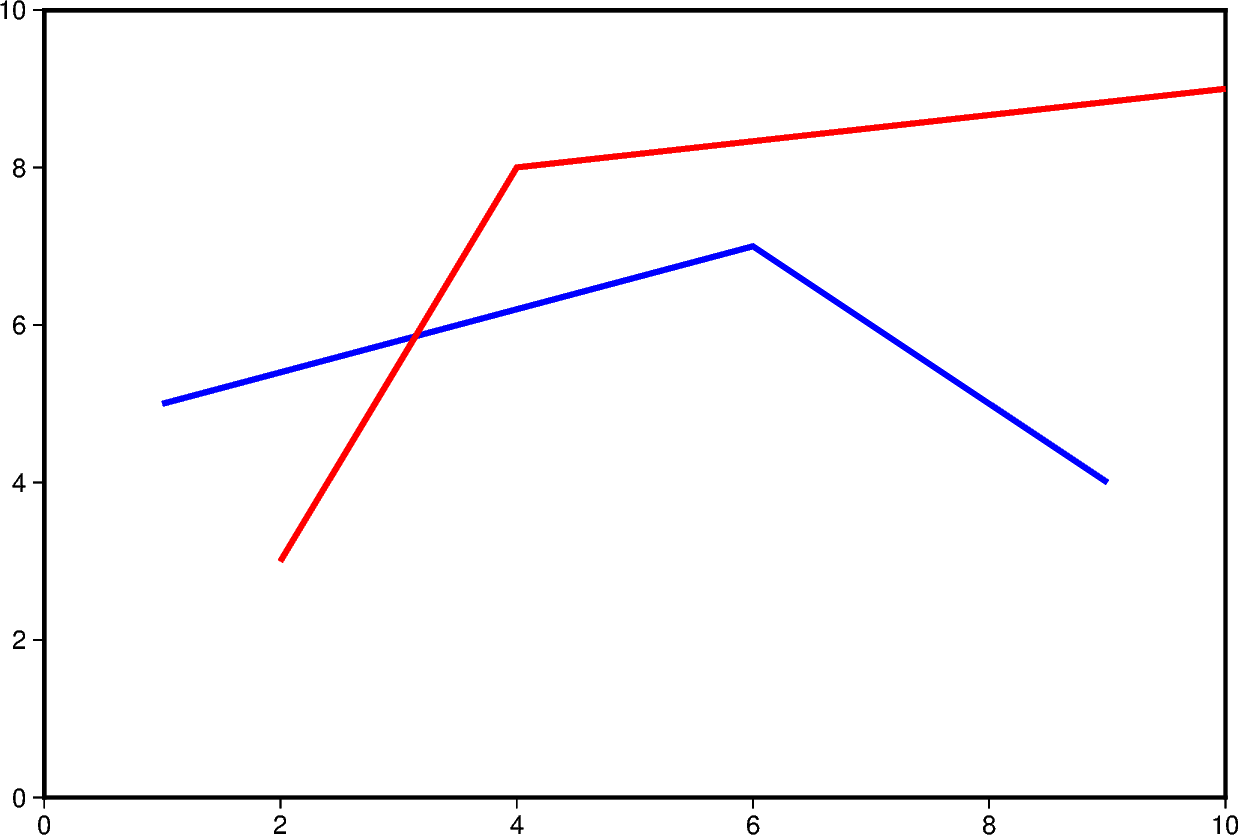
To plot multiple lines, pygmt.Figure.plot needs to be used for each
additional line. Arguments such as region, projection, and frame
do not need to be repeated in subsequent uses.
fig = pygmt.Figure()
fig.plot(
    region=[0, 10, 0, 10],
    projection="X15c/10c",
    frame="a",
    x=[1, 6, 9],
    y=[5, 7, 4],
    pen="2p,blue",
)
fig.plot(x=[2, 4, 10], y=[3, 8, 9], pen="2p,red")
fig.show()
Out:
<IPython.core.display.Image object>
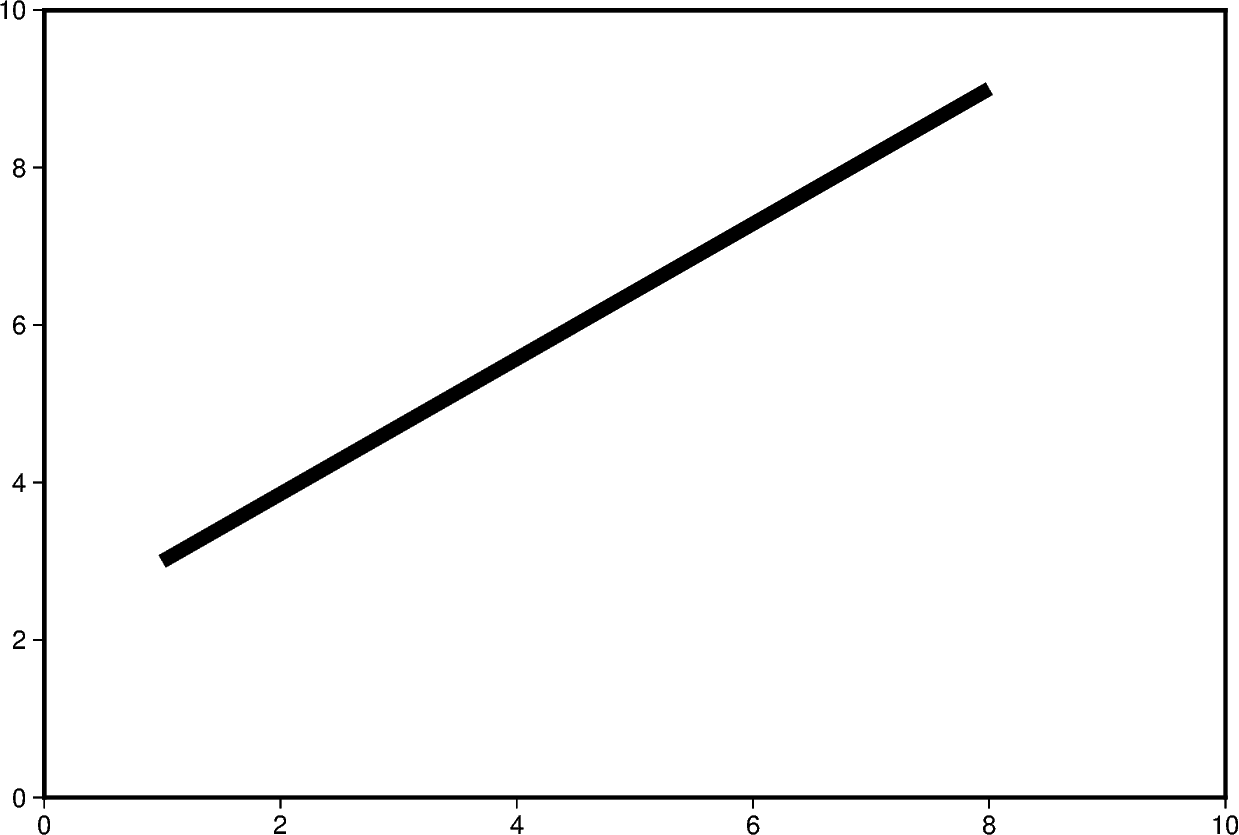
Change line attributes
The line attributes can be set by the pen parameter. pen takes a
string argument with the optional values width,color,style.
In the example below, the pen width is set to 5p, and with black as
the default color and solid as the default style.
fig = pygmt.Figure()
fig.plot(
    region=[0, 10, 0, 10],
    projection="X15c/10c",
    frame="a",
    x=[1, 8],
    y=[3, 9],
    pen="5p",
)
fig.show()
Out:
<IPython.core.display.Image object>
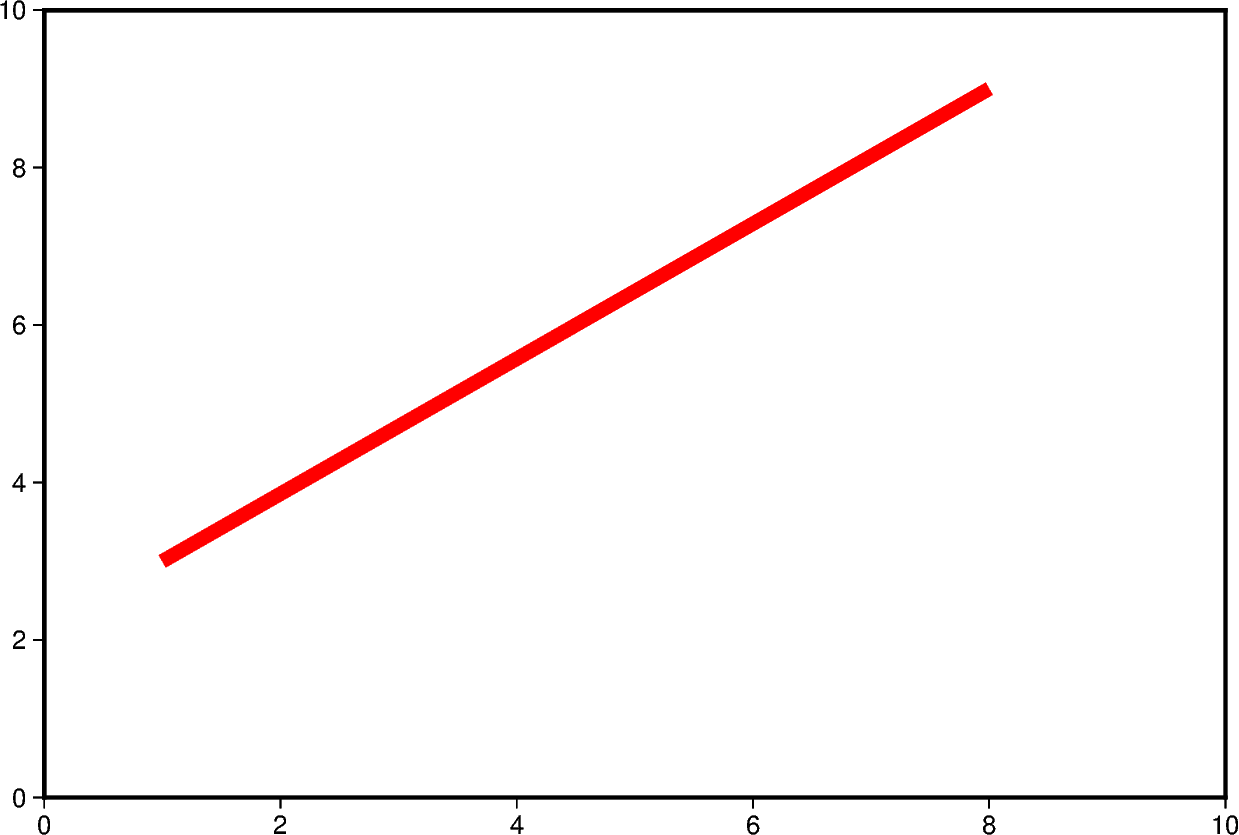
The line color can be set and is added after the line width to the pen
parameter. In the example below, the line color is set to red.
fig = pygmt.Figure()
fig.plot(
    region=[0, 10, 0, 10],
    projection="X15c/10c",
    frame="a",
    x=[1, 8],
    y=[3, 9],
    pen="5p,red",
)
fig.show()
Out:
<IPython.core.display.Image object>
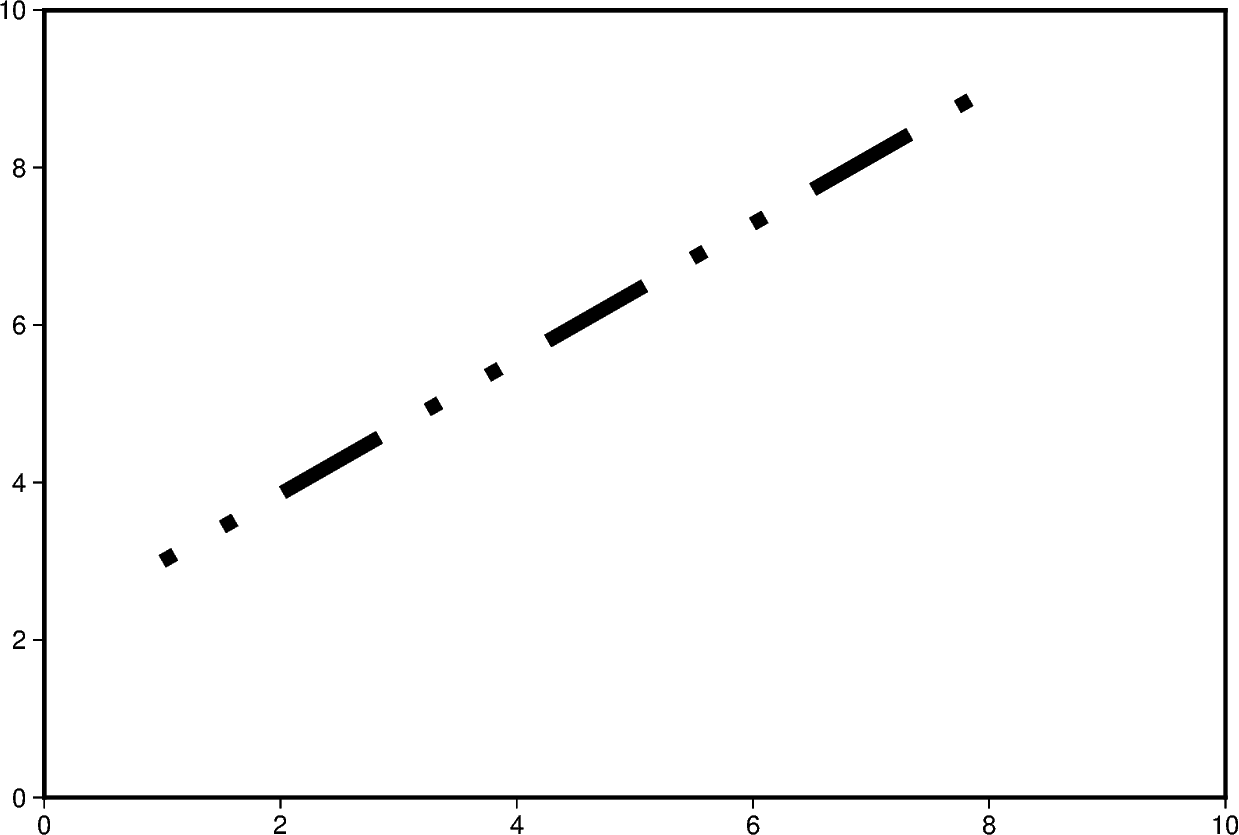
The line style can be set and is added after the line width or color to the
pen parameter. In the example below, the line style is set to
..- (dot dot dash), and the default color black is used.
fig = pygmt.Figure()
fig.plot(
    region=[0, 10, 0, 10],
    projection="X15c/10c",
    frame="a",
    x=[1, 8],
    y=[3, 9],
    pen="5p,..-",
)
fig.show()
Out:
<IPython.core.display.Image object>
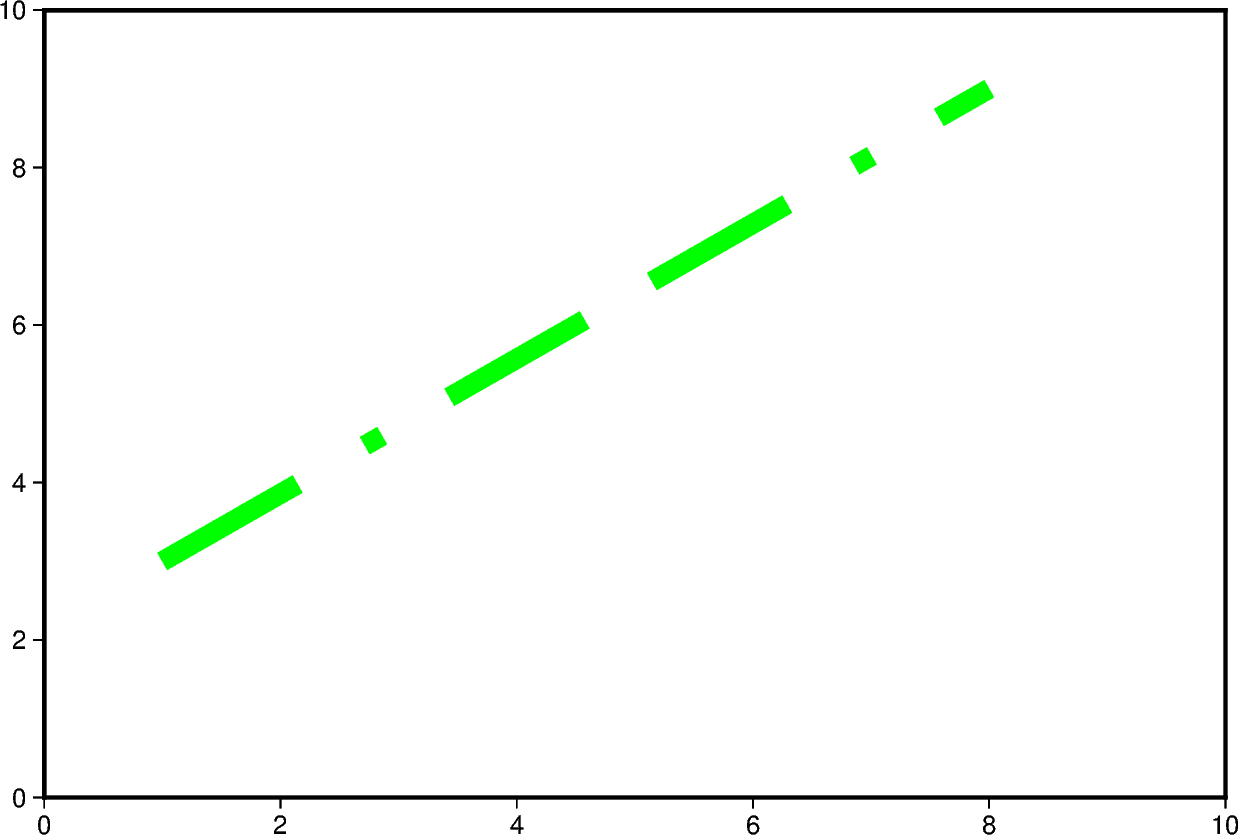
The line width, color, and style can all be set in the same pen
parameter. In the example below, the line width is set to 7p, the color
is set to green, and the line style is -.- (dash dot dash).
For a gallery showing other pen settings, see
Line styles.
fig = pygmt.Figure()
fig.plot(
    region=[0, 10, 0, 10],
    projection="X15c/10c",
    frame="a",
    x=[1, 8],
    y=[3, 9],
    pen="7p,green,-.-",
)
fig.show()
Out:
<IPython.core.display.Image object>
Total running time of the script: ( 0 minutes 7.341 seconds)